Contents 

About
What's New
Purchase
Comparison
Getting Started
Introduction
User Interface
Creating Profile
Log Files
General Information
Log Formats
Filters
Creating Filters
Frequently Used Filters
Reports
Report Format
Report Contents
Click Overlay Report
Custom Tables & Charts
Standard Tables & Charts
General Statistics
Activity Statistics
Access Statistics
Visitors
Referrers
Browsers
Errors
Goals
Tracked Files
Profile Properties
General
Log Files
Time Range
Tracking
Filters
Report
Program Options
Analysis
General
Files
Date & Time
Geolocation
Ignore Lists
Log Cache
Report
Format
Items
Tables
Contents
Web Server
Browser
Network
DNS
Proxy
E-mail
Automation
Schedule
Schedule Task
Command Line
Date Macros
Web Server
Web Server
FAQ
Installation and Backup
Log Files
Analysis
Reports
Scheduler
Glossary

WebLog Expert Help

Prev Page Next Page

Web Server

[Requires Enterprise Edition]

This category allows you 
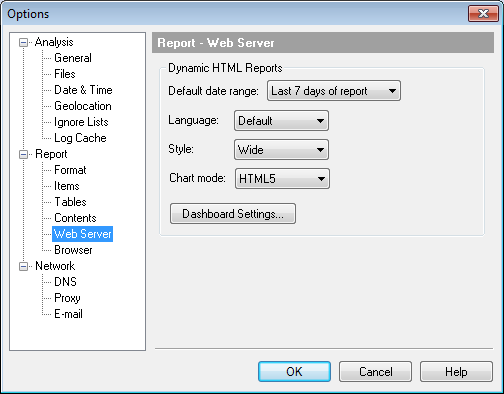
to specify settings for dynamic HTML reports shown by a web server.

Default date range:

Default date range in dynamic HTML reports.

Language:

Report language. By default language specified in Options > Report > Format is used.

Style:

Report style.

Chart mode:

You can choose to use either HTML5, Flash or image charts. In most cases HTML5 charts should be used. They are supported in Internet Explorer 9 and newer and all other modern browsers including mobile ones. If it is necessary to view the reports in Internet Explorer 8, you can choose the Flash or image mode. In the Flash mode the charts are shown using Flash by default, while if no Flash is available image charts are shown instead automatically.

Dashboard Settings:

These options allow you to enable or disable dashboard in dynamic HTML reports as well as specify which report items to show in the dashboard. You can also specify custom dashboard settings for specific profile in Profile Properties > Report.